I finished writing an ETL process today. I know, you’re so jealous. Actually it was pretty fun, it pulls in some cool data. Although it was satisfying to have it working, some quick calculations showed it was going to take, “um, way too long” (58 hours!).
List stuffToProcess = Stuff.findAllByProcessedIsNull()

stuffToProcess.each {stuff ->
    try {
        Map data = someRestServiceClient.fetchDataThatTakesOneSecond(stuff)
        importService.storeTheStuff(data, stuff)
    } catch(Exception e) {...}
}
enter the Groovy Parallel features to the rescue.
List stuffToProcess = Stuff.findAllByProcessedIsNull()

GParsPool.withPool(64) {
   stuffToProcess.eachParallel {stuff ->
      try {
         Map data = someRestServiceClient.fetchDataThatTakesOneSecond(stuff)
         importService.storeTheStuff(data, stuff)
      } catch(Exception e) {...}
   }
}
Two lines of code and it’s 10 times faster!
Did I really, findAllByProceessedIsNull(), thereby trying to get an OutOfMemory exception? No, the whole thing was wrapped in a for loop to grab reasonable batch sizes.
Long totalThings = Stuff.count()

for (int i = 0; i < totalThings; i += batchSize) {
    List stuffToProcess =
        Stuff.findAllByProcessedIsNull([max: batchSize, offset: i])
And why a pool size of 64 (GParsPool.withPool(64))? Since it was already batched I increased the pool size with each batch. Initially I stopped at 22 (see graph). Some further fiddling showed performance increases up to 64.This is on a Quad Core Macbook Pro, where most of the work involves waiting for some webservice calls to complete. It doesn’t really make much sense since the GParsPool is supposed to work well with just a few threads but that’s what I measured.
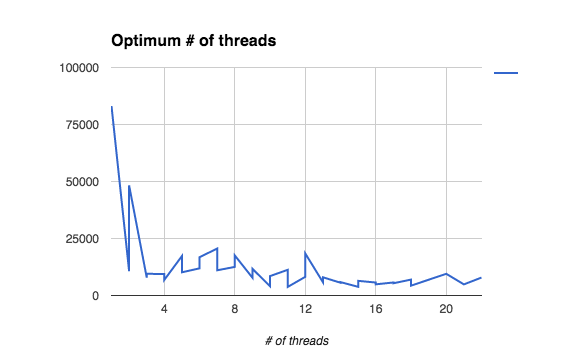
The graph combines data from two runs so there are two Y values (milliseconds) for each X value (# of pseudo-threads).
